A little over a month ago you may recall that there was a bit of a short-lived furore over claims that female TV presenters routinely disappear from our screens once they reach the age of 50.
The source of this claim was a Labour Party policy review group with the rather ostentatious title of the “Commission on Older Women” and, more specifically, Labour’s current Deputy Leader, Harriet Harman who, let’s be honest, has more than enough previous form when it comes to statistics abuse to justify checking her figures yourself even if she were to tell you that two plus two equals four.
To give a quick recap, the headline claims that appeared just over a month ago in the New Statesman were that:
Women account for 48 per cent of TV presenters under 50 but just 18 per cent of TV presenters above that age (despite representing 53 per cent of all over-50s).
While TV presenters are broadly reflective of age in the general population (30 per cent of TV presenters are over 50 compared with 34 per cent of the UK population) they are wholly unrepresentative in terms of gender.
Only 5 per cent of all presenters and 7 per cent of the total TV workforce (on and off-screen) are women over the age of 50.
Out of a total of 481 regular on-air presenters at the BBC, Sky, ITN and Channel 5, just 26 are women aged over 50.
And we were also told that Harman obtained these figures after writing to the main terrestrial broadcasters (BBC, ITV/ITN, Channel 4 and Channel 5) and Sky News back in February, although we’re not told exactly when she received a response from each of them, and Harman’s data was also given to The Guardian where it was published in full on its Datablog.
The Guardian article gives us one or two keys piece of information including the actual question that were put to broadcasters, which asked specifically for the gender balance figures for all ‘regular on screen TV presenters’ and for those aged 50 and over and that the BBC included radio presenters in its figures in addition to providing a breakdown of the figures for each broadcaster in the spreadsheet that goes with the article.
So far, so good and if we look just at the figures supplied by the BBC then, according to the data released by Harman, of 417 presenters on BBC TV and radio, 36% are female and 64% are male but when we look specifically at the over 50’s, which account for 30% of the BBC’s presenters, that falls to just 20% female and 80% male.
On the same day that that information was published I fired off a request to the BBC under the Freedom of Information Act 2000 in which I asked specifically for the exact same information that had been given to Harman but with it broken down into the standard 5-year age bands used widely in official statistics.
In regards to the information supplied to the Older Women’s Commission, as released here by the Guardian’s Datablog, I would like you to provide the same data but with the age profile for both male and female presenters broken down by standard 5 year age bands, i.e. under 20, 20-24, 25-29, etc. rather by reference solely to whether they are aged over or under 50 years of age.
Why?
Well, partly because of Harman’s dodgy track record when it comes to the use of statistics but also because, as I wrote at the time, I suspected that even if the figures were correct the actual situation they were describing was likely to rather more complicated that Harman was trying to suggest, particularly in terms of cohort effects and the legacy effect of the BBC’s recruitment policies of 30-40 years ago, which is when most of it’s older presenters would have first entered the industry; things that wouldn’t be readily apparent in Harman’s data but which might show up in a more detailed breakdown of the same figures.
The BBC’s response arrived yesterday and… well, what I got from them presents us with a bit of a puzzle, which you can see for yourself by downloading the response I received from this link.
For one thing, unlike Harman, I didn’t get any exact head counts from the BBC. These figures were withheld by the Beeb citing the FOI exemption in section 40 of the act, which deals with personal data that’s covered by the provisions of the Data Protection Act:
Under section 40(2) of the Act, we are withholding the actual headcount in each of the categories. As the request relates to a small number of staff, this could lead to individuals being identified. Personal information about living individuals is exempt if disclosure to a third party would breach one or more principles of the Data Protection Act 1998. As individuals who work at the BBC do not expect their personal details to be disclosed, to do so would be unfair; therefore, disclosure would breach the First Data Protection Principle, fairness.
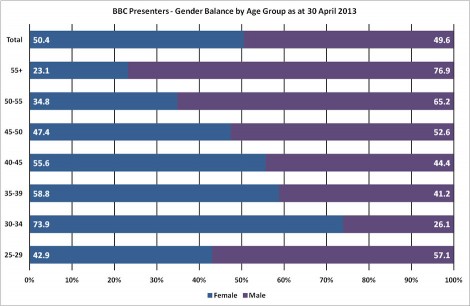
Fair enough, all that means is that all I got from the Beeb was a percentage figure for male and female presenters in each age band, which the letter says is based on counting the numbers of people employed by the BBC on either permanent or freelance contracts in which the job title includes the word ‘presenter’ as of 30 April 2013, but that is much less of a problem than the actual figures I received, which are set out in this graph:
Now we really have a problem because, according to Harman’s figures, just 36% of the BBC’s presenters across all age groups are female, but the figures released by the BBC in response to my own FOI request put that same figure at 50.4%.
So what’s going on here and why the huge discrepancy in the figures?
Well that’s a good question and a few possibilities do spring to mind.
One is that Harman’s figures were compiled in March, before the end of the financial year, and that what we’re seeing the the result of a turnover in contracts at the of the financial year which has seen the BBC either hire considerably more female presenters, lose a considerable number of male presenters or a combination of both. That’s I think is extremely unlikely just because the shift in numbers from Harman’s near 2:1 split in favour of men to a more or less 50:50 split in the figures I was sent is just too large to be plausible.
Another possibility is that Harman asked specifically about regular on-screen (or on-air as the BBC included figures for its radio stations) but left it to the BBC to decide for itself how to define regular, so the discrepancy may have arisen because although the BBC employs pretty much the same numbers of men and woman in presenting roles overall, its actually men who get the lion’s share of the regular gigs.
And yet another possibility here is that the figures I’ve been given relate only to people who are directly employed by the BBC under contract as presenters, whether permanently or an a freelance basis, and it’s possible that the figures given to Harman could have been compiled by a different method, one which includes presenters who aren’t directly contracted by the BBC because for some the external production companies from which the BBC commissions part of its broadcast output.
Likewise, it’s also possible that an element of confusion has arisen here over the use of the word ‘presenter’, in which case Harman’s figures may include people who work for the BBC in presenting roles but who aren’t defined specifically as presenters in their BBC contract. Is Jeremy Paxman, for example, contracted as presenter or perhaps journalist/presenter or does his contract simply say that he’s employed as a journalist. If it’s the latter then he won’t be included in the figures I was sent but he may be included in those sent to Harman, if they were compiled on some basis other than what it says in people’s contracts.
Whatever the explanation for this discrepancy, what is clear is that the figures I’ve been sent are very different to those released by Harman, and not just across the board but also for the over 50s because there is absolutely no way of combining the relative male-female percentages given for the two over 50s age groups that will give us the 80:20 male-female split.
So what is clear from all this is that the figures released by Harman just over a month ago cannot be taken to be reliable, at least as far as the BBC is concerned because, if nothing else, the manner in which she worded her questions is too vague and too open to interpretation (and misinterpretation) to provide an accurate picture of the gender balance amongst BBC presenters.
In short, if Harman and the Commission on Older Women want to be taken seriously then they need to go back to the drawing board and resubmit their questions to the BBC in a much more specific form, one which more clearly identifies exactly which information they require.
So, bearing all that in mind, what does this new data from the BBC tell us about gender ratios and age amongst the corporations presenters?
Well, if we go back to the raw figures released by Harman those indicated that of 413 regular presenters of all ages on TV and Radio, 150 (36.3%) were female and 263 (63.4%) were male.
Of those, 127 were aged over 50 of which just 25 (19.7%) were female, giving us 102 (80.3%) male presenters in same age brackets and so of the remaining 286 presenters, all of whom were under 50 years of age, 125 (43.7%) were female and 161 (56.3%) were male.
Based on those figures alone, you could easily be forgiven for thinking that gender-wise things look fairly even for male and female presenters up until the age of 50, after which opportunities for female presenters fall off a bit of a cliff, and that is, of course, the argument that Harman was hawking around the press along with the following comments:
Harman said: “The figures provided by broadcasters show clearly that once female presenters hit 50, their days on-screen are numbered.
“There is a combination of ageism and sexism that hits women on TV that doesn’t apply to men in the same way.
“It is an encouraging first step that broadcasters have been open in providing these statistics. Their response shows that they all recognise that this is an important issue that needs to be addressed.
“I will be publishing these figures annually so we are able to monitor progress.”
But, if you look at the figures that obtained from the BBC they tell a rather different and much more nuanced story.
For one thing, the distribution in gender ratios for presenters under 50 is considerably less even, when you break it down by 5 year age bands, than Harman’s rather crude figures might suggest.
In the lowest 25-29 age group, men outnumber women by 57-43 but after that women have the upper hand in the next three age bands, which span the ages of 30-45 with the highest ratio (74-26) being found in the 30-34 age band and it is only when we reach the 45-50 age ground that men again being to outnumber women by around 52-48.
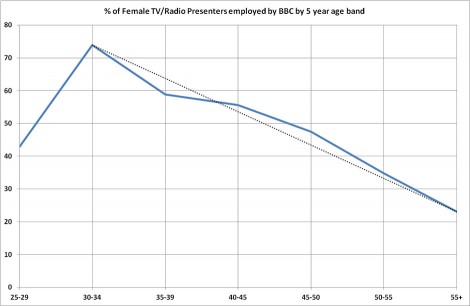
Moreover, far from their being a sudden cliff over which female presenters fall once they reach the age of 50, the data shows that gender balance at the BBC peaks in favour of women in the 30-34 age band after which there is a steady decline in the gender ratio, as can be seen more clearly in this graph which looks only at the percentage data for female presenters by age.
Okay, the blue line shows the actual percentage of female presenters out of all presenters in each age band while the dotted black line shows what the trend line would look like were there an even decline in the percentage of female presenters across all age bands from 30-34 onwards and you can see that the two lines run pretty close together all the way along the graph.
So if, as Harman claims, the explanation for the relatively low number of female presenters aged over 50, compared to the number of male presenters, is indeed a ‘combination of ageism and sexism’ then the problems appear to kick in well before women reach the age of 50 – the single largest fall between any two adjacent age bands is actually to be found in the change in the figures between the 30-34 and 35-39 age bands – too early, in fact, for Harman’s arguments to carry much in the way of plausibility as an overarching explanation for this trend.
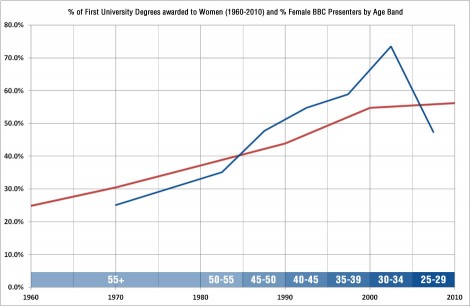
There are, I think, better explanations here one of which can be seen in the following graph, which shows the long term trend in the percentage of first degrees awarded to women by UK universities from 1960 to 2010 onto which I’ve also mapped the data for the percentage of female BBC TV and Radio presenters by age band, showing when those women are most likely to have been in higher education.
From this graph we can see quite clearly that the pool of female graduates from which the BBC could recruit people who would go on to become TV and radio presenters was considerably smaller in the past, relative to the numbers of male graduates at the same time, particularly at the time that presenters in the 50-55 and 55+ age bands would have been entering the industry.
Not only was the female graduate pool much smaller in relative terms in the past, it was also considerably in real terms. In 1960 there were just 5,575 first degrees awarded to women, a figure which rose to just 25,319 in 1980 when the first of the current 50+ generation of broadcasters was entering higher education. In 2010, 185,740 first degrees were awarded to women by UK universities, which is 56.2% of all first degrees awarded that year.
Nevertheless, what we can also see is that although it took until the mid 1990’s for women to achieve parity with men in terms of the numbers entering higher education and obtaining a first degree, women who chose a career in broadcasting or in fields that feed into broadcasting, such as print journalism, have actually been more successful in holding down careers in broadcasting, relative to male graduates, since the mid-to-late 1980s despite the fact that it would appear, from the figures for the 25-29 age group, that it still takes women a little longer to get into the industry on the ground floor.
The equation here is simple enough that even Harriet Harman should be able to understand it. A smaller pool of females graduates in the past (25+ years ago) both in total and relative to the numbers of male graduates at the time, means a smaller proportion of women going into the broadcast sector, and into other fields that feed the broadcast sector (e.g. print journalism) at entry level – and this will inevitably result in a smaller proportion of female broadcasters in the 50+ age bands today.
That’s not ageism, that just a cohort effect and if sexism is a factor here then Harman will need a time machine to address it at its source… 25-50 years ago.
For female presenters to be ‘disappearing’ from the broadcast sector at the age of 50 they have to been working as presenters in the first place. What the data obtained from the BBC via FOIA strongly suggests is that, at least in regards to the BBC, that simply wasn’t the case.


