I am unashamedly a fan of the work of fact checking organisations and websites, not least amongst which is the excellent Full Fact.
However, as a stats hound myself, I am also very much aware of the limitations and occasional pitfalls of the standard fact check model used by most such organisations., particular when claims are based on statistical information.
One is that the statistical information on which a factual claim is based may not, of itself, shed much light on the accuracy of what is actually being claimed. Correlation does not, of course, automatically imply causation and although a particular statistic or trend my appear, when taken at face value, to support a particular conclusion there may well be better explanations to found in other data sets which lie outside the scope of the claimed factual that is most immediately being checked.
The second issue, which is very much related to the first, is that fact checking organisations are necessarily generalists who deal with a wide range of often unfamiliar datasets such that a lack of familiarity with data that they’re working with can, on occasions, lead them to overlook or fail to recognise something in that data that does shed considerably more light on the factual question they’re seeking to answer than they may realise at the time.
These are not major issues, nor do they devalue the work of these organisations. Rather they’ve serve to remind us all that there is more to statistics than crunching numbers and knocking out pretty infographics. Interpretation matters and the best fact checking organisations, of which Full Fact are one, are certainly aware of this and invariably exercise appropriate caution when reaching their conclusions.
A very good example of the kind of issues I’m referring to has cropped up in very topical question, that of marriage equality, in relation to the following claim by Mark Pawsey MP in the debate that followed Monday’s statement on the government’s proposals to legislate for equal marriage by Culture Secretary, Maria Miller.
“Given that marriage rates in Spain and Holland collapsed after the introduction of same-sex marriage, does she [Maria Miller] not fear that in this country even fewer couples intending to have children will choose to marry?”
Full Fact’s evaluation of the factual elements of this question, the assertion that marriage rate in Spain and Holland collapsed following the introduction of same-sex marriage can be read here and this led them to reach the following conclusions, which are perfectly reasonable within the scope of their investigation of these claimed facts:
Conclusion
The most general message to take is that while some states, such as those specified by Mr Pawsey, do show a correlation between legalising same-sex marriage and falling levels of marriage (although, crucially, not necessarily a causation), other countries didn’t show this at all, and some even saw modest increases in marriage levels immediately following the new laws.
Without further study it’s impossible to account for the state-specific factors such as the level of public support for the legalisation in the first place.
The analysis also doesn’t tell us how the heterosexual population would react to a change in marriage legislation. This isn’t good news for readers of the Huffington Post’s headline eager to find evidence for this startling claim.
In any case, in the absence of more detailed studies of the effects of same-sex marriage legislation, a mere appeal to marriage statistics isn’t going to answer this question, and we shouldn’t treat the citation of some countries’ marriage rates as sufficient evidence.
There is. nevertheless, rather more that can be said of Mark Pawsey’s claimed collapse in the marriage rates in two of the eight European countries, to date, that have legislated for same-sex marriage, if one is just a little bit more familiar with the dynamics if these particular demographic statistics.
To really make sense of trends in marriage statistics one has to take a much longer terms view than did Full Fact is assessing Pawsey’s claims, which chose to limit the scope of its own investigations to a period, for each country, starting a mere five years before the legalisation of same-sex marriage. This is because what we see in marriage statistics is a reflection of both long term trends shaped by changes in, and interactions between, population demographics, sociocultural attitudes and legislative amendments that can have either a direct, or indeed indirect, impact on marriage; examples of which would include not only changes in marriage and divorce laws but also legislation and regulations affecting the legality and availability of elective abortions, contraception, etc.
Marriage is also susceptible to influence by shorter-term trends and even, in rare instance, quite singular events.
If one looks closely enough, one can often see economic trends reflected in marriage statistics. In times of recession and rising unemployment, couple who might have married may well put their plans on hold until the economy picks up their financial circumstances improve, particular where the desire to marry is tied in with a desire to have children and start a family, all of which can be pretty expensive when one takes into the costs of setting up a home to go with the marriage and the hoped for children.
Perhaps the most spectacular example of single event affecting marriage rates, certainly since World War II, is to be found in the marriage date for Sweden where, in 1989, the number of marriages shot-up from a relatively stable average of around 38,500 marriages a year to over 108,000 in 1989, of which 60,000 took place in a single month (November) before dropping back down the usual 35-40,000 marriages year from 1990 onwards.
The cause of that sudden spike in Sweden’s marriage rate was nothing more than a change in its welfare benefits system, the abolition of the-then state widow’s pension on 1 Jan 1990. The legislation to make this change was passed in the Summer of 1989, although the issue of revising the widow’s pension had been on the table for decades before the government actually made a move on it, so it wasn’t considered a significant or even interesting issue. However, when the legislation was passed in included both a transitional arrangement under which the widow’s pension would still be payable, under the same terms that existed up to 1990, to women who married before 1 Jan 1990 and who had a child at the time of the their husband’s death. From 1990 onwards, however, a heavily revised scheme would come into effect, one in which the size of the pension would be calculated to take into account the widow’s income in addition to that of her newly deceased husband with the net effect being that few widows would receive a pension and those that did would get only a minimal amount of money from the state.
The upshot of all this was that a considerable number of couple that had been happily cohabiting for years without any real thoughts of getting married suddenly found themselves confronted with a very reason to get hitched, and when you throw in a bit of media coverage in which the press were talking up an expected increase in the number of weddings due to the pension changes and the possibility of a shortage in the number of appointments in which weddings could take place, and Sweden had all that it needed for a sudden marriage rush.
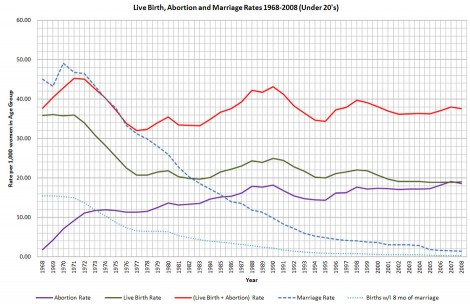
So, when we’re looking at marriage data there are both long-term and short-term trend to consider and this in perhaps best illustrated using the data I put together for an article I wrote quite a while ago on trends in teenage pregnancy, which I’ve mapped onto the following graph – and for all graphs in this article, you can click on them to get a larger image.
What we have are the long-term trends from 1968 to 2008 for women under 20 for marriage, live births, live births within eight months of marriage, abortion and conceptions, which are represented by a combined figure for live birth and marriages (because figures for all conceptions and/or conceptions ending in a miscarriage are extremely to come by and don;t cover anything like the full period for which I have data for everything else). All figures are given in rates per 1,000 women under 20.
This is the story of teenage pregnancy and marriage in England and Wales over 40 years and the main long-term trends should be pretty obvious – a big decline in marriages, a much smaller decline in pregnancies and a convergence over time between the number of live births and the number of abortions/ There are also some clear short-term trending the data, for example the substantial fall in live births, abortions and conceptions during the first half of the 1990’s which is best explained as a cohort effect generated by the government’s relatively large scale investment in the HIV/AIDS public health campaign and its incorporation into sex education in schools, which ran from 1987 to around 1990 before being finally killed off in 1992 when the Tories chose to go ‘Back to Basics’ and start lecturing young people about sexual morality rather than providing high quality public health information and risk-reduction based sex education. As for the 3 year lag between the start of this campaign and the downturn in teenage conceptions, etc. the most likely explanation for this is a lag in getting across the risks of HIV/AIDS to the heterosexual population due to its initial emergence in the gay community and amongst intravenous drug users.
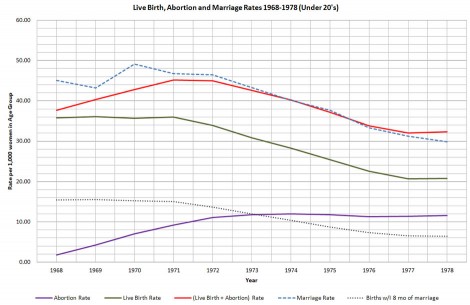
Equally interesting, as an illustration of marked short-term trend, is the data for 1968-78, which covers the first ten years following the legalisation of elective abortions, which you can see in more detail in this graph.
What is very noticeable on this graph is the very close relationship between the trends for conceptions (i.e. live births + abortions) and marriages which runs from 1971 to 1977, and what we see is both a rise in number of abortions but also a significant drop in the number of live births and conceptions, one that is too large to be accounted for solely by the rise in the abortion rate. The legalisation of abortion was not the only significant event that occurred towards the end of the 1960’s that impacted on fertility and marriage. At roughly the same time, the rules on the availability of oral contraceptives were relaxed to enable single women to obtain the pill without having to go to the trouble of borrowing a wedding ring and pretending to be married and, as we can see, for a number of years there a very close and direct relationship between young women gaining effective control of their own fertility and both marriage rates, generally, and the number of live birth occurring within 8 months of marriage, which – give or taken a few premature births – can be also regarded as the ‘shotgun wedding’ rate.
That relationship began to break down around 1976-1977 with shift upwards in the trends for conceptions and live births but no significant compensatory rise in abortions while marriage rates continued on their downward trajectory. The most likely trigger for that change was a widely publicised health scare which linked oral contraceptives to an increase risk of cancer, which kicked off in 1975, from which began the process of normalising unmarried parenthood. What is, however, both ironic and depressing about these events is that the actual health scare that hit in 1975, damaging women’s confidence in oral contraceptives, related solely to the first generation of contraceptive pills, very few of which were still in use at that time, not that this accurately reflected in the media coverage of the time.
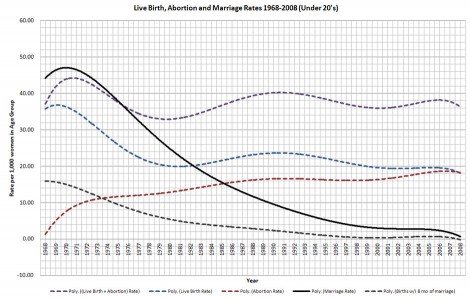
Graphs of this kind work well for illustrating both short and long-term trends but they’re rather noisy – although trends shown on the graph follow a particular trajectory, annual variations in the figures or rates can be a little off-putting and serve to confuse and even obscure long-term trends, particularly if you’re not used to dealing with this kind of information, so another useful way of showing long-term trends, in particular, is to use the underlying data to plot smooth polynomial trend lines. This does entail a trade-off, because you lose the short-term detail, but it can and does help to clarify the trajectory of long-term trends and, in particular, make it a little to identify when those trends started to kick in.
Sticking with same data I’ve used above, this is the polynomial trend plot for the full dataset from 1968 to 2008.
And, of course, we can see the same clear long-term trends, especially the major fall-off in marriages and the convergence between live births and abortions which shows that teenagers are getting pregnant at broadly similar rates each year since the mid 1980’s, so there has certainly been no explosion in teenage conceptions, but what has changed markedly over that same period are the choices teenagers make when they do fall pregnant, where they are more likely to terminate a pregnancy than they are to choose to give birth, a trend which rather undercuts tabloid claims that young women are deliberately having babies for the sake of getting a council flat and a hand out from the state.
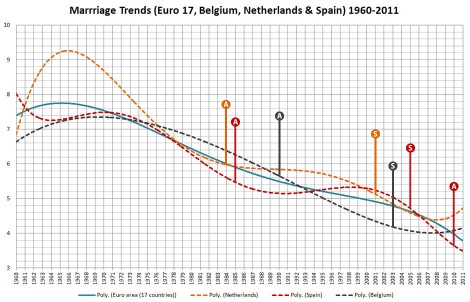
Now, getting back, at least, to Mark Pawsey’s claims about same-sex marriage, we can use this same type of plot to look at the long terms trends in marriage rates in those EU countries have already legalised same-sex marriage, of which there are three for which we have a reasonable amount of post-legalisation data – the Netherlands (which legalised same-sex marriage in 2001), Belgium (2003) and, of course, Spain (2005). On this graph, I’ve plotted the trend line for the Euro-17 group of countries, in line with its use by Full Fact and, in addition to marking when the legalisation of same-sex marriage occurred, I’ve also marked legislative changes for all three countries which resulted in a liberalisation of their abortion laws, given that our own data shows at least an indirect relationship exists between abortion and marriage rates as both can be linked to to trends in the birth rate.
Before showing you the graph, one final word of caution. In the case of Belgium – and possibly also the Netherlands and Spain albeit perhaps to a lesser degree, safe abortions could be obtained before the point at which abortion was formally legalised. What Belgian doctors did, in particular, prior to legalisation, was register abortions under ‘curretage’ so the paperwork noted only that woman had undergone a procedure which entailed the scraping of the lining of their womb while omitting to mention whether or not there was also a foetus in there at the time.
Now, let’s get on with the show.
The data comes from Eurostat and spans the full period from 1960 to 2011 with the exception of the Euro-17, which is missing a couple of years at either end of the plot, but not so much as through the trend line off.
So the first and most obvious thing we see is that long-term trend in marriage rates in the Eurozone and all three individual countries has been running firmly downhill since the 1970s, and although it took all three countries lagged behind the UK in legalising abortion – give or take any unofficial arrangements that pre-date legalisation – all show a marked downward trend in marriage starting in the late 1960’s or early 70’s, the same period during which oral contraceptives became much more widely available to single women. This also, perhaps, explains why none of three individual countries shows obvious signs of a drop-off in marriage rates linked to the legalisation of abortion although, again, we may well not have a complete picture of exactly when abortion became generally available if, as happened in Belgium, doctors were actively involved in circumventing the law.
In regards to same-sex marriage, what we can see very clearly is the overall trajectory of long-term trends in marriage rates were already heading downwards in all three countries at the time that same-sex marriage was legalised.
In the case of Belgium, the trend had been heading downwards since the beginning of the 1970’s but was slowing at the point at which same-sex marriage was legalised in 2003 and, since 2007, is has actually turned the corner and started to head upwards a little. No significant evidence there, then, of a heterosexual backlash against marriage since same sex marriage was legalised.
In the Netherlands, marriage had a bit of a mini-renaissance in the late 80’s and early 90’s, although not enough of one to do anything more than stabilise things for a few years, but between 1993-4 and 2007, the long term trend was running downhill only for there to have been a mini-revival similar to that in Belgium over the last four years or so – and in both cases one has to suspect that demographic changes arising from inward migration may account for most, if not all, of the recent upswing in the trend.
What there isn’t however, is any clear indication of a collapse in the Dutch marriage rate following the legalisation of same-sex marriages in 2001 – on the underlying dataset, the marriage rate actually went up slightly in 2002 before reverting back to its previous downward trend the following year, a mini-spike in the rate that most likely reflects the addition of same-sex ‘early-adopters’ to the 2002 figures.
That leaves use with Spain, where the long-term trend pitched downwards in 2000, five years before same-sex marriage was legalised and the only country of the three that saw a modest downwards acceleration in the long-term trend following the introduction of same-sex marriages, although even this has started to abate a little over the last three years.
Is this, at last, Pawsey’s heterosexual backlash against same-sex marriage?
No.
Taking 2004 as our starting point as the final year in which marriage was an exclusively heterosexual preserve in Spain, the annual number of marriages celebrated in the country fell by just over 14,600 over the first three years (2005-2007) in which same sex couples were able to get in on the marriage game.
For the next three years (2008-10), the annual number of marriages fell by 34,000, rising to just under 41,500 for the four years from 2008-2011.
Now I know the pace of life in Spain is a little slower than it is in Northern Europe, but “mañana” just doesn’t cut it as an explanation for that kind of lag, so is there a better explanation for the apparent collapse in Spanish marriage rates?
Of course there is, and it lies squarely in Bill Clinton’s First Law of Politics – IT’S THE ECONOMY, STUPID.
With nothing more than a quick trip back to Eurostat when we find is that, in 2007, the male unemployment rate in Spain sat at a healthy-looking 5.6%, even though the rate for under 25s looked just a bit sickly at 15.2%. After that, of course, the supply of credit went crunch, the Spanish housing market went from boom to bust and the shit didn’t so much hit the fan as someone parked several slurry tankers in front of a wind farm and turned all the valves up to eleven. For 2011, the male unemployment rate in Spain sat at an eye-watering 21.1% while fully 48.2% of the flower of young Spanish manhood get to start the day, every day, with the joys of ‘La mañana de La 1’ which I’m reliably informed is the Spanish equivalent of ‘This Morning’.
So, if you want to blame anyone for the recent collapse in the Spanish marriage, you can blame the bankers, or the Spanish government’s mishandling of the economy, or maybe even the Germans, if you’re that way inclined…
…just don’t blame Spain’s LGBT community, because they’re in the exact same shit everyone else over there.


I do like the idea of some people being so bothered by gay marriage that they’d not get married as a result. The funny thing is that because those same people probably don’t believe in sex before marriage, that would mean they would never be able to have children at all, and would take themselves out of the gene pool.
Let’s hope they’re right!