According to Andrew Lansley, speaking at an NHS Clinical Commissioners conference in April, “age is the principal determinant of health need” from which it follows, logically, that the NHS should devote a greater proportion of its resources towards providing health care services is those areas of the country with the largest elderly populations.
Its a superficially plausible argument. After all, its common knowledge that people’s healthcare needs increase and become more complex as they get older.
However, as with most arguments that are based on ‘common knowledge’ it doesn’t take a great deal of investigation to discover that HL Mencken’s maxim that there’s a ‘well known solution to every human problem – neat, plausible and wrong’ applies just as readily to the allocation of NHS resources as it does to anything else for which politicians offer up ‘simple solutions’.
So let’s look at the evidence.
We’re using two data sources here, both of which come from the Office of National Statistics’ Neighbourhood Statistics website.
The first data table gives the mid year population estimates for local authority wards in England for 2010 by broad age group, and the age group we’re interested in covers males over the age of sixty-five and females aged over sixty – gender equality has yet to fully infiltrate the world of official statistics.
The second data table gives the health deprivation indices for each local authority ward in England over five specific domains:
– A combined health deprivation index score.
– Years of Potential Life Lost: An age and sex standardised measure of premature death. (2004-2008)
– Comparative Illness and Disability Ratio: An age and sex standardised morbidity/disability ratio. (2008)
– Acute morbidity: An age and sex standardised rate of emergency admission to hospital. (2006-07 and 2007-08)
– Mood and anxiety disorders: The rate of adults suffering from mood and anxiety disorders. (2004-2008)
To make the comparisons a little easier, average scores for each local authority in England – 326 in total – have been calculated from the ward level data, and the local authorities have been ranked in terms of both the percentage size of their elderly population and their average score on each of the health deprivation domains.
If, as Andrew Lansley claims, age is the principle determinant of health need, then plotting the size of the elderly population against any of the health deprivation measures should produce a graph with a trendline that looks more or less like this:
 If we also plotted the individual data points on the graph we’d expect to see that most of them would lie fairly close to this trend line – in statistical terms, if age is the primary determinant of health need then we’d expect to see a strong positive correlation (>0.5) between the number of elderly people living in each local authority and the health needs of that local authority, as measured by each of these health deprivation indices.
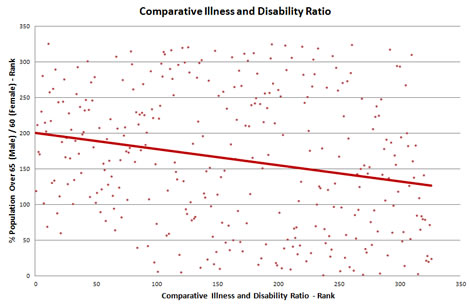
That’s the theory now lets look at the facts, starting with the comparative illness and disability ratio, which is a general measure of the prevalence of ill heath and disability for each local authority.

Oops… that’s not what we were expecting – far from showing a strong positive correlation between the size of the elderly population and the prevalence of ill health and disability, what we have across England is actually a weak negative correlation (-0.22). Age may a be a factor in determining health needs but this graph suggests that its far from being the primary factor, as Andrew Lansley contends.
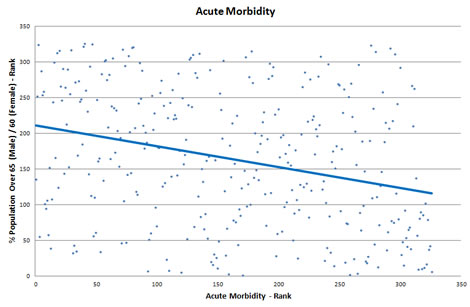
What about acute morbidity, i.e. emergency hospital admissions?

Again, far from finding a strong positive correlation what we actually have is a weak negative correlation (-0.29), albeit one that close to moderate in strength (+/- 0.3-0.5) and we find the same pattern when we look at both the overall health deprivation index (-0.19) and the potential life years lost, which is a measure of premature mortality (-0.27).
The only domain which show a positive correlation between age structure and ill health is the mood and anxiety disorders domain (0.14), and if I were in a cynical mood I might be tempted to run a comparison between that metric and sales of the Daily Mail and Daily Express.
In short, and contrary to ‘common knowledge’ – at least within the upper echelons of the Conservative Party – the age structure of local authorities is very poorly correlated with the ONS’s primary measures of health deprivation, i.e. poor health. Basing NHS resource allocations on age, alone, is a very poor and unfair method determining local funding levels as it, literally, amounts to robbing the sick and infirm in order to devote the greatest amount of resources to those who are lucky (and wealthy) enough to enjoy good health while living to a ripe old age.
This being the case, one should hardly be surprised to discover that when Clare Bambra, Professor of Public Health at Durham University, ran the numbers and looked the impact that Lansley’s age-based funding regime would have on regional NHS resource allocations, she found that the winners and losers fell into a very familiar pattern.
Severing the link with deprivation will skew resources disproportionately towards areas with high utilisation and high concentrations of the elderly. This will lead to a considerable shift of health care funding away from the neediest, poorer areas of the North and the inner cities and towards the least needy, most affluent and most elderly areas of the South. It also means more money for Conservative voting areas and less for Labour voting areas.
How considerable a shift? Well, based on current per capita funding allocations Bambra came up with these estimates for the impact that a shift to age-based funding would have on existing NHS regions.
| Strategic HA |
% gain/loss |
| North East |
-14.9 |
| North West |
-12.0 |
| Yorkshire & Humber |
-5.8 |
| West Midlands |
-5.1 |
| London |
-0.5 |
| East Midlands |
-0.4 |
| South West |
7.4 |
| East England |
9.8 |
| South East Coast |
12.6 |
| South Central |
15.8 |
Even within regions, Lansley’s plan will see significant amounts of funding shifting from the poorest to the richest areas.
Within London, Bambra’s calculations suggest that age-based funding would give Kensington and Chelsea a boost in funding of around 16% while Richmond and Twickenham could expect an increase of just over 30%. Meanwhile, Tower Hamlets would see its funding cut by 19-20%%, as would Newham and Hackney, while the worst hit areas in England would be Knowsley, Liverpool, Manchester and Stoke-on-Trent, all of which could expect to see anything from a fifth to a quarter of their current funding heading south – literally.
Besides Richmond, Twickenham and Kingston upon Thames, the other big winners in Lansley’s new health lottery would be Surrey, West Berkshire, Buckinghamshire and Oxfordshire, all of which would be set to receive inflation-busting increases of 20% plus.
That’s Lansley’s new NHS funding plan – robbing the poor, sick and infirm to keep the healthy and wealthy in while-u-wait hip replacement operations.
Both the acute morbidity and the illness and disability ratio are listed as “An age and sex standardised”. What does this mean in these cases?